Up to 24 Months of Data
Select any rolling 24-month window of historical tick data for your chosen instrument and session. Data is sourced from aggregated broker feeds and is updated weekly.

Backtesting
Quivarra's backtesting engine simulates your strategy against real historical tick data and returns a detailed performance report.
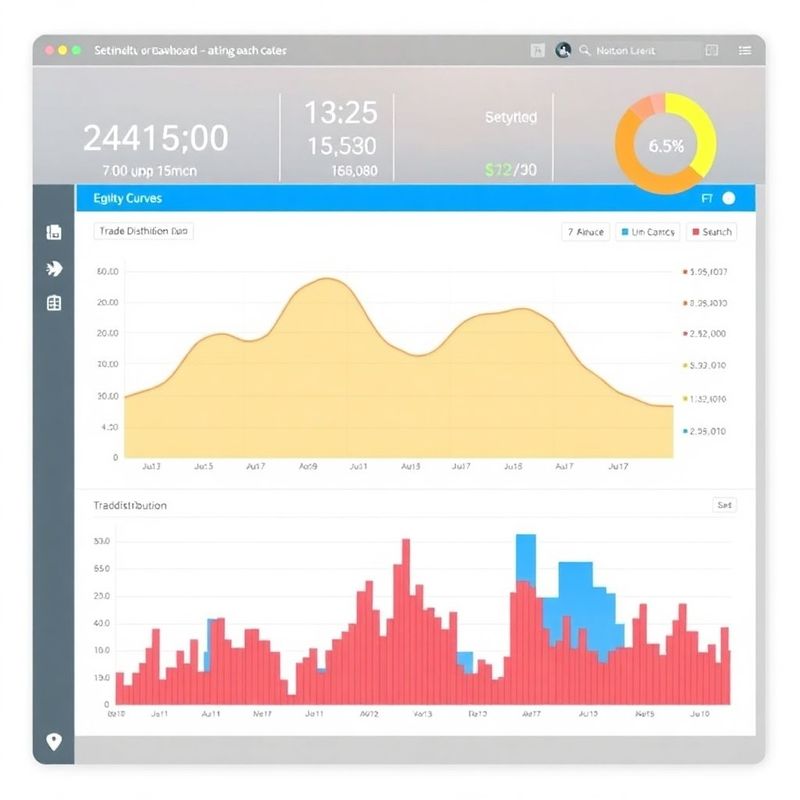
A Quivarra backtest runs your exact rule set — the same logic that the live engine will use — against a selected historical data range of up to 24 months. The resulting report provides: total trades simulated, win rate, average winner and loser size, maximum consecutive drawdown, Sharpe ratio estimate, slippage-adjusted fill simulation and session-by-session breakdown. Slippage is modelled using the median spread recorded by your broker during the equivalent historical periods, making the simulation materially more realistic than fixed-spread models. The report is exportable as a CSV and a one-page PDF summary, both of which can be saved to your account history for comparison across strategy iterations.
It is important to understand what backtesting does not guarantee. Historical performance is computed on past data; future market conditions, broker spreads and liquidity can and do differ. Quivarra's slippage model is an approximation — actual fill quality in live trading depends on your specific broker, session volatility and account tier. The platform does not adjust backtest results to look better than they are, and we do not hide drawdown periods or outlier losing streaks. You should review the maximum drawdown figure carefully and verify that your risk controls are configured to halt the live engine before that threshold is approached. Backtesting is a diagnostic tool, not a return forecast.
Select any rolling 24-month window of historical tick data for your chosen instrument and session. Data is sourced from aggregated broker feeds and is updated weekly.
The report isolates each drawdown period, its depth and its recovery duration so you can assess how the strategy behaves under sustained adverse conditions.
Fill prices are adjusted using historical median spreads from your broker's data, producing a more realistic picture of execution costs than theoretical models.
Download your backtest results as a structured CSV or a one-page PDF summary. All past reports are stored in your account for iterative comparison.
Select your instrument, set your date range and let Quivarra produce the evidence before you go live.